


Ever feel like your team is playing a corporate version of "Telephone," where information gets more garbled with each passing?
You’re not alone! In fact, inefficiencies and miscommunications in business processes cost companies up to 30% in lost revenue every year. That’s a staggering amount of potential slipping through the cracks — all because of disjointed workflows and siloed knowledge.
But even though it’s a common issue that businesses face, no one particularly wants to be part of that club. Good news: There's a straightforward way to turn things around and get your team operating like a well-oiled machine. Meaning no more confusion and much more clarity.
You need to give your team a holistic understanding of your business processes. When everyone sees the full picture, alignment and efficiency naturally follow. And if you're wondering how to bring that clarity to life, updating your flowcharts can become the secret weapon to visualizing and streamlining your processes.
Why business leaders should prioritize a holistic view of processes
First things first, let’s make sure we’re on the same page about what “business processes” really are. (We like to think of ourselves as experts on the subject.)
Think of them as your company's secret sauce — AKA, the workflows, procedures, and operations that keep everything running smoothly. Whether they’re for marketing campaigns, customer service, or inventory management, these processes form the backbone of your day-to-day operations, ensuring you and your team are doing things the right way for the best results. Every. Single. Time.
Now, imagine this: Hannah from the marketing department is designing social media campaigns, but she has no clue who to turn to for posting. Meanwhile, Mallory in operations is making inventory decisions without realizing how they impact the customer service team across the hall. It’s like trying to assemble a puzzle without being able to see the image on the box — and eventually, everything breaks down and someone flips a table.
Without a clear visualization of how each step in a process connects, it’s easy for teams to miss key details or end up working in isolation. But when everyone can see the entire process as a whole, it’s a game changer.
The benefits of visualizing processes from start to finish
When your team can see how a process flows from their starting point to the end result, everything becomes clearer and more efficient. Suddenly, they’re able to spot inefficiencies, work more cohesively, and make faster, better decisions.
Here are some of the benefits:
- Clarity and transparency: A visual map of your process eliminates confusion, making sure every team member knows exactly how their actions contribute to the overall workflow.
- Fewer bottlenecks: When you can see the whole process, it becomes easier to spot and resolve bottlenecks before they become major issues.
- Streamlined collaboration: Viewing processes this way encourages teams to work together more effectively by providing a clear roadmap of how different roles and responsibilities fit together.
- Smoother communication: When each team member understands the process as a whole, it becomes easier to communicate across departments and avoid missteps.
- Faster decision-making: With a clear visual of the workflow, employees can make quick, informed decisions without the usual back-and-forth or guesswork.
- Empowered employees: A clear visual map of the process gives employees the confidence to own their roles and make strategic contributions, knowing exactly how their efforts impact the final outcome.
Now, imagine a workplace where every employee can see entire processes from beginning to end, working in sync to reach shared goals. That’s the power of visualization — and one simple tool can make your imagination a reality.
Flowcharts: Your secret weapon for holistic understanding
You know flowcharts — they are the heroes of process clarity. They can transform even the most complex business processes into simple, easy-to-follow diagrams. Whether you’re dealing with intricate workflows or trying to make sense of interconnected tasks, flowcharts are here to save the day.
Let’s talk about why flowcharts make processes so easy to understand:
- They make complex processes crystal clear. Flowcharts can take tangled workflows and break them down into bite-sized pieces that are easy to understand. With everything laid out visually, even the most complicated operations become more digestible.
- They map out workflows, showing how everything connects. One of the biggest advantages of flowcharts is their ability to show how different tasks and departments interconnect. This holistic view allows your team to see the entire process and how their role fits into the bigger picture. Mind = blown.
- They help spot inefficiencies faster than you can say “bottleneck.” By visualizing workflows, flowcharts make it easier to identify problem areas or bottlenecks. This allows you to address inefficiencies and streamline processes more effectively.
- They make training and onboarding a walk in the park. Flowcharts are perfect for onboarding new employees. Everyone learns differently — so instead of overwhelming your visual learners with long-winded explanations, you can provide a clear roadmap of how things work, making training much simpler and faster.
Think of flowcharts as a map for your business processes — helping your team navigate workflows with ease, so no one gets lost.
Powering up the outdated flowchart model
So, flowcharts are undeniably powerful tools for visualizing and simplifying complex processes. We’ve already talked about how easy it is to see how different tasks and decisions link together in a clear, logical flow.
But as helpful as this traditional flowchart model is, it’s only the starting point. While linking steps in a process is useful, businesses today need more than just a visual guide — they need a deeper connection to the actual procedures, policies, and roles those steps reference.
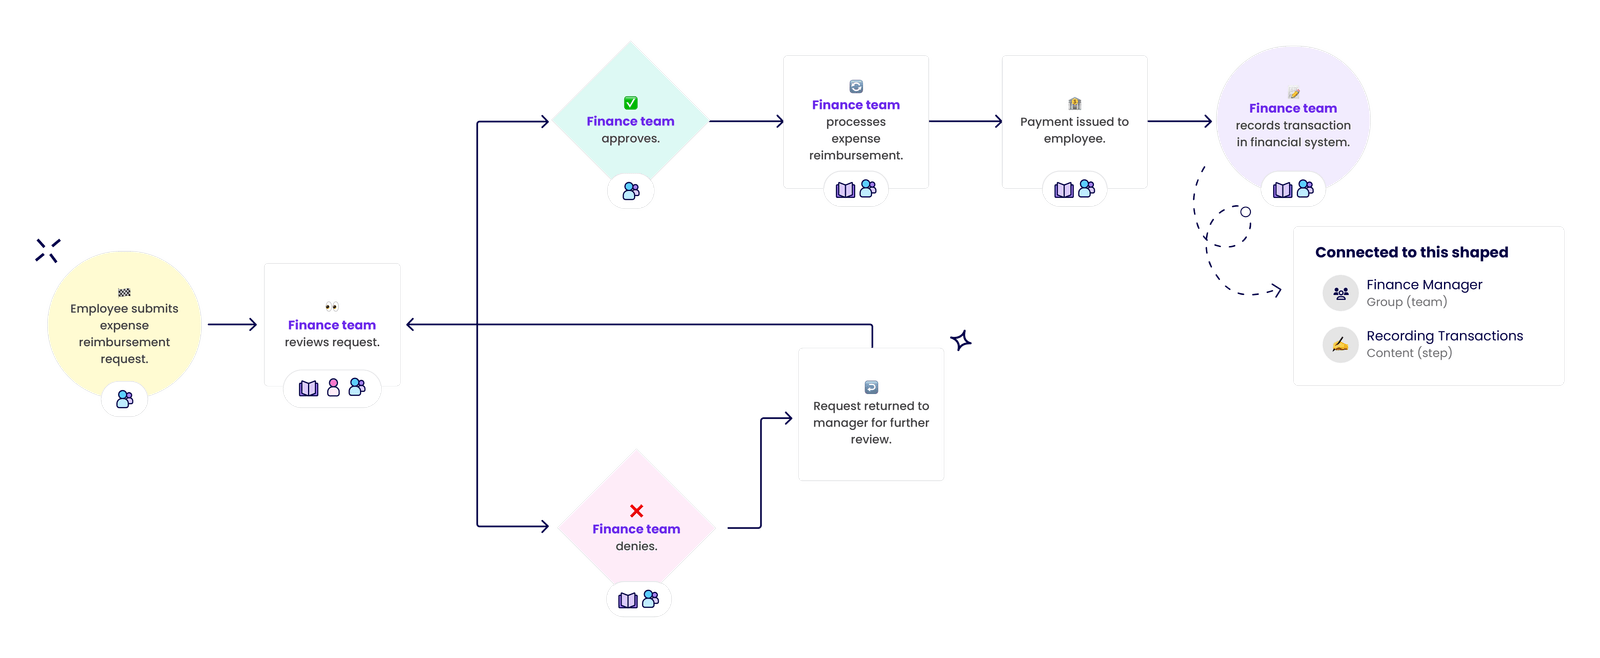
So, imagine Flowcharts 2.0: where you can embed detailed step-by-step instructions, policy guidelines, and role-specific responsibilities directly into the flowchart itself. Instead of a simple visual map, you’re creating an all-in-one resource where your team can access everything they need to complete each task. This transforms a basic flowchart into a comprehensive training tool that employees can use not just for reference, but for real-time learning.
When you link each process to the exact procedures and responsibilities involved, you ensure that nothing is left to guesswork. This kind of enhanced flowchart doesn’t just simplify processes — it streamlines onboarding and training, giving your team immediate access to the full scope of information needed to perform their roles effectively from day one.
Creating flowcharts that rock: A how-to guide
Ready to unleash the power of mapping out your business flows? Step into our office, and we’ll walk you through the guide to creating effective and dynamic flowcharts:
Step 1: Identify your processes.
Which of your processes is currently causing the most confusion for your employees? Maybe it’s your differentiating what sales does versus what account managers do, where tasks are unclear, or perhaps your product development cycle has become a bit chaotic.
It could even be something as simple as restocking the office coffee supply. (Let’s be real — keeping the caffeine flowing is crucial!) Focus on the processes that need the most clarity — that way, you’ll create the biggest impact.
Step 2: Choose your platform.
Next, choose the tool that will help you bring your flowchart to life. It should have an intuitive interface that makes it easy to map out even the most complicated workflows — and allows you to create flowcharts that link to your documented processes, policies, and role responsibilities. (You can probably guess our favorite option.)
Build your flowcharts in Trainual
Did you know that Trainual has a brand-new flowchart functionality? Quickly outline processes in a clear, visual format — helping your team see the big picture while focusing on the details that matter.
You may have used something like Miro to map out your processes in the past — which is perfectly fine when you just need a quick visual representation of how your processes work (AKA, the flowchart version 1.0). But now, you can create flowcharts right where all your business knowledge is centralized — in Trainual. So you can seamlessly link to best practices, key players, and essential information every step of the way.
That means you get the best of both worlds: easy-to-follow, visual guides and access to detailed instructions when and where you need it. It's a comprehensive tool that equips your team to execute processes efficiently, from start to finish.
Step 3: Design like a pro.
Here are some tips for designing flowcharts that work for you and your team:
- Keep it simple! Don’t overwhelm your chart with every detail of your business. Focus on clarity.
- Use standardized symbols. Keep your shapes consistent — like using rectangles for tasks, diamonds for decisions. It’s flowcharting 101.
- Avoid going overboard. Keep the details manageable and easy to follow.
Step 4: Get your team involved.
Your team knows these processes best, so tap into their expertise. Involving them in the creation ensures accuracy and gives them ownership of the final product. Get their insights into the overall structure of the flowchart, which roles need to be included, and what parts will need extra clarity with linked processes and policies.
With these steps, you'll have flowcharts that bring clarity, boost productivity, and keep everyone on the same page. A holistic understanding of business processes isn't just nice to have — it's essential for helping your team reach their high-performance potential. And flowcharts? They're your secret weapon for making that understanding a reality.